Preparing for launch…
Agency Ops Dashboard
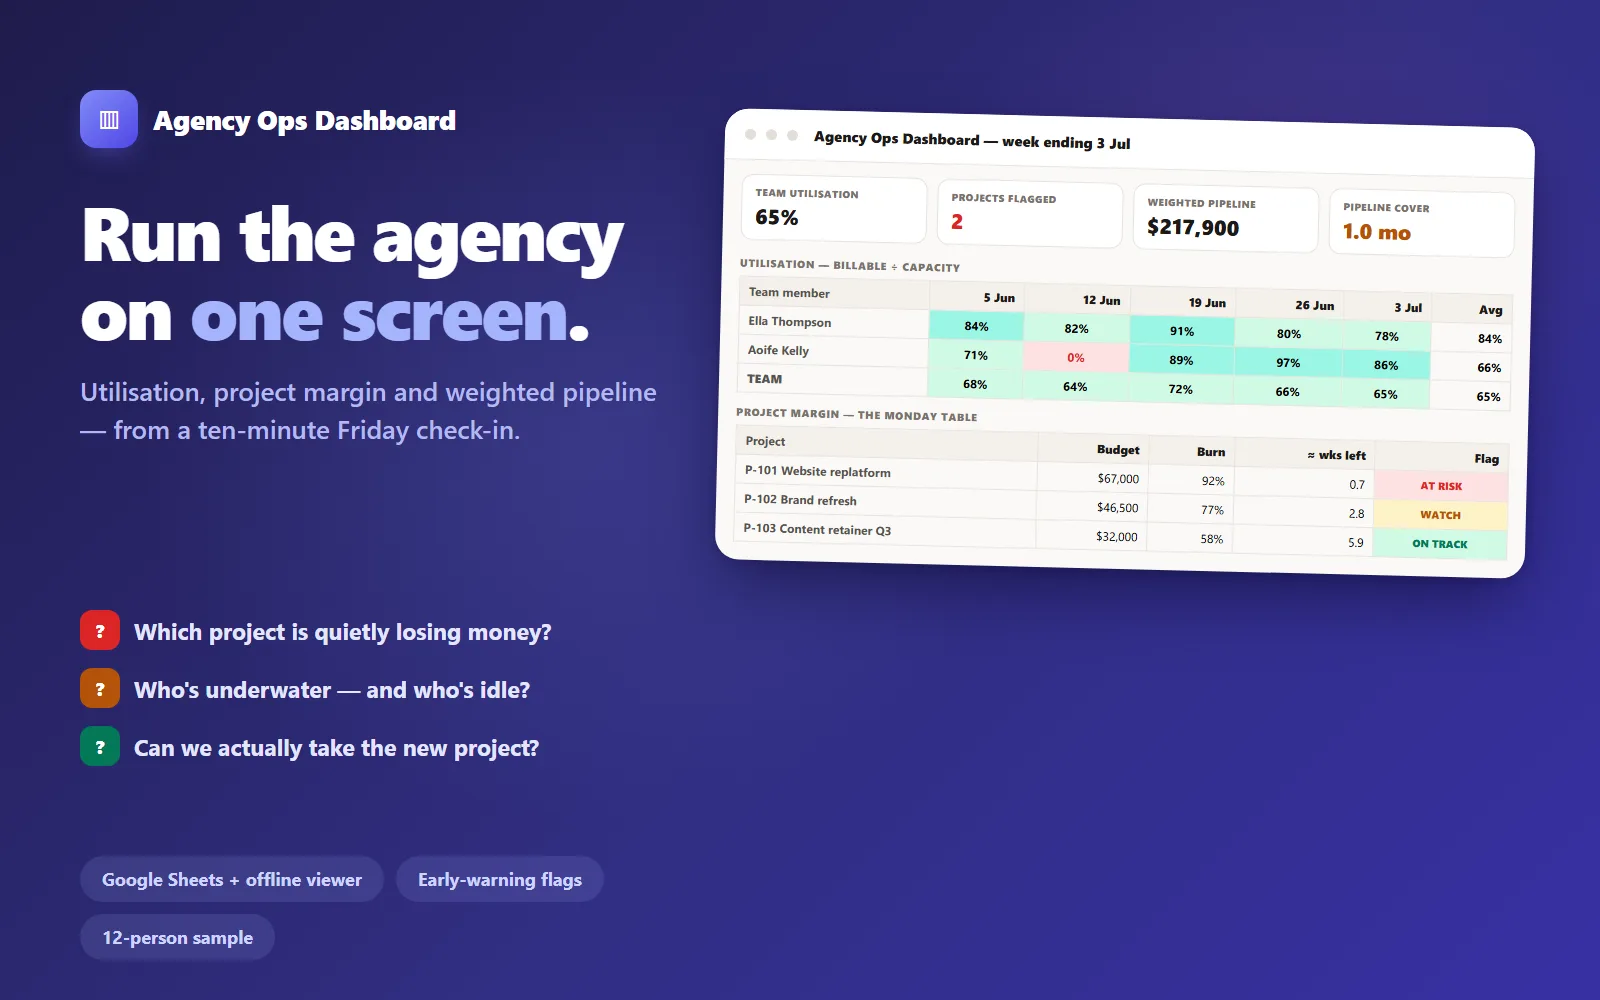
Utilisation, project margin and weighted pipeline on one screen — from a ten-minute Friday check-in. Google Sheets build plus an offline viewer that computes the same numbers.
What it does & who it's for
Three questions run every agency: who's underwater, which project is quietly losing money, and can we actually take the new work? This dashboard answers all three from one ten-minute Friday habit. The system is four simple tabs — Team, Projects, Timesheet, Pipeline — feeding one dashboard. Utilisation is computed the honest way: billable hours over contracted capacity, with leave and internal time lowering the number instead of hiding in a shrunken denominator. Project margin burns every logged hour against fee budgets at loaded cost rates, with early-warning flags at 70% (WATCH — a scope conversation is still cheap) and 90% (AT RISK — act this week), plus a weeks-left-at-pace column so a fast burn can't hide behind a percentage. The pipeline is weighted by stage probability and divided by what a month of your team is actually worth at target utilisation — pipeline cover in months, the number that says "book work now" while the current flagship still looks busy. You get it two ways. The Google Sheets build: a formulas guide covering every cell — exact ranges, named ranges, the three ARRAYFORMULA helpers, conditional formatting — with a verification checklist against the included sample so you know your build calculates correctly. And the offline viewer: a single HTML file that opens in any browser, loads the same CSV, and renders the full dashboard — utilisation heat grid, margin flags, pipeline cover — with zero Google account, zero uploads, zero network calls. If the sheet and the viewer agree, your build is right. The sample data is a fictional 12-person agency, 8 weeks deep, with a story in it: one project at 92% burn with 0.7 weeks of margin left, another drifting into WATCH, a team averaging 65% against a 70% target, and exactly one month of weighted pipeline cover. The live demo is the offline viewer with that sample preloaded — drag the thresholds and watch the flags respond. kpi-definitions.md is the piece most dashboards skip: every metric defined precisely, the trap it protects you from, the argument it settles — plus the five-line honesty contract that keeps the numbers true (starting with: nobody's utilisation is quoted in a performance conversation).
What's included
- dashboard.html — the offline viewer: open in any browser, load the CSV, full dashboard with utilisation heat grid, margin flags and pipeline cover; live threshold controls; zero network calls - dashboard-data.csv — the workbook source and input template: Team, Projects, Timesheet and Pipeline sections preloaded with the 12-person sample agency - sheets-formulas-guide.md — every formula for every dashboard cell: tab layouts, named ranges, the three helper ARRAYFORMULAs, the margin-flag logic, conditional formatting, and a verification checklist against the sample - kpi-definitions.md — every number defined and defended: the trap each metric protects you from, the argument it settles, and the five-line data-honesty contract - README-setup.md — the 60-second look, the 30-45 minute Sheets build, the weekly ritual, and the sceptical-team rollout guide
What's not included
- Time-tracking software — the Friday check-in IS the timesheet (ten minutes, and the rollout guide covers getting a sceptical team to do it) - Accounting integration — cost rates are loaded once from your real numbers (the quick method is in kpi-definitions.md) - A hosted service — the Sheet is yours, the viewer runs locally, nothing phones home - Per-seat pricing — one licence covers your whole agency
Requirements
- A free Google account for the Sheets build (30-45 minutes, every formula supplied) - Any modern browser for the offline viewer — no account needed - A team willing to log hours for ten minutes each Friday (the rollout guide does the persuading)
Setup instructions
1. Open dashboard.html in your browser and load dashboard-data.csv — the 60-second look at what you're building, with the sample agency's story in it. 2. Read kpi-definitions.md with your leadership team — agree the definitions before the first review. 3. Build the Google Sheet from sheets-formulas-guide.md (30-45 minutes): six tabs, named ranges, three helper formulas, the dashboard sections, conditional formatting. 4. Run the verification checklist — eight checks against the sample prove your build calculates correctly. 5. Replace the sample with your team, projects and pipeline; set your cost rates the loaded way (the quick method is in the KPI guide). 6. Book the Friday check-in (10 min, whole team) and the Monday review (15 min, leadership) — the README's weekly ritual runs both.
Version history
- v1.0Latest8 Aug 2026
Licence & terms
Licence terms
Single-agency commercial licence. Use the dashboard to run one agency or studio — any team size — and adapt it freely for that business. You may not resell, redistribute or re-list the files, the formulas guide or derivatives of them as a template or product, whether paid or free.
Refund policy
14-day refund if the product is materially not as described in this listing or its demo. The demo is the real offline viewer with the sample agency loaded — read the flags, drag the thresholds, judge the logic before buying. Refunds are not offered for change of mind. Open a refund request from your Launchstock library and we will respond within 2 business days. An approved refund ends your licence to the product — you must delete all copies of the files and stop using them.
Support terms
Email support (hello@ledgerandline.com) for 3 months from purchase, replies within one business day. Covers the Sheets build, the verification checklist, formula fixes on unmodified builds, and loading your own CSV into the viewer. Custom metric development is available as paid work.
These terms are snapshotted at purchase — what you see here is what applies to your order.
Reviews
No reviews yet
Reviews come from verified purchasers only, so you can trust what you read here.
More in Data & Dashboards
Other listings buyers compared with this one.
 Test-run
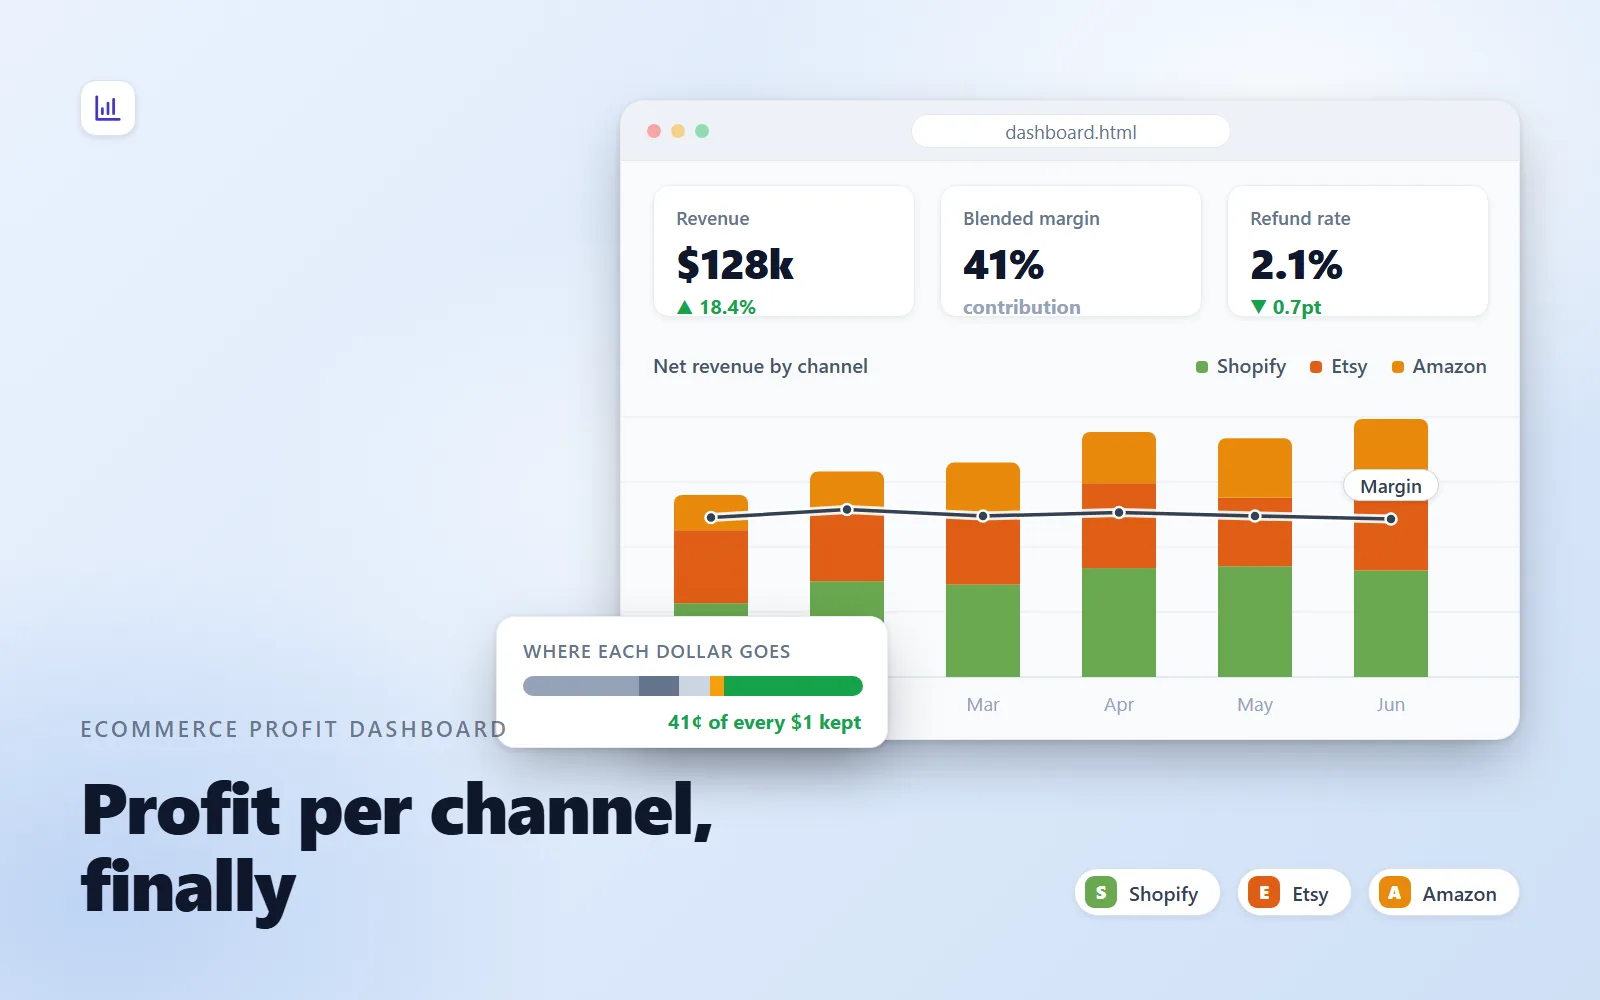
Ecommerce Profit Dashboard
Load an orders CSV and see contribution margin by channel — revenue, COGS, fees, shipping, ad spend — in one zero-backend HTML file.
Live demoLedger & Line$79
 Test-run
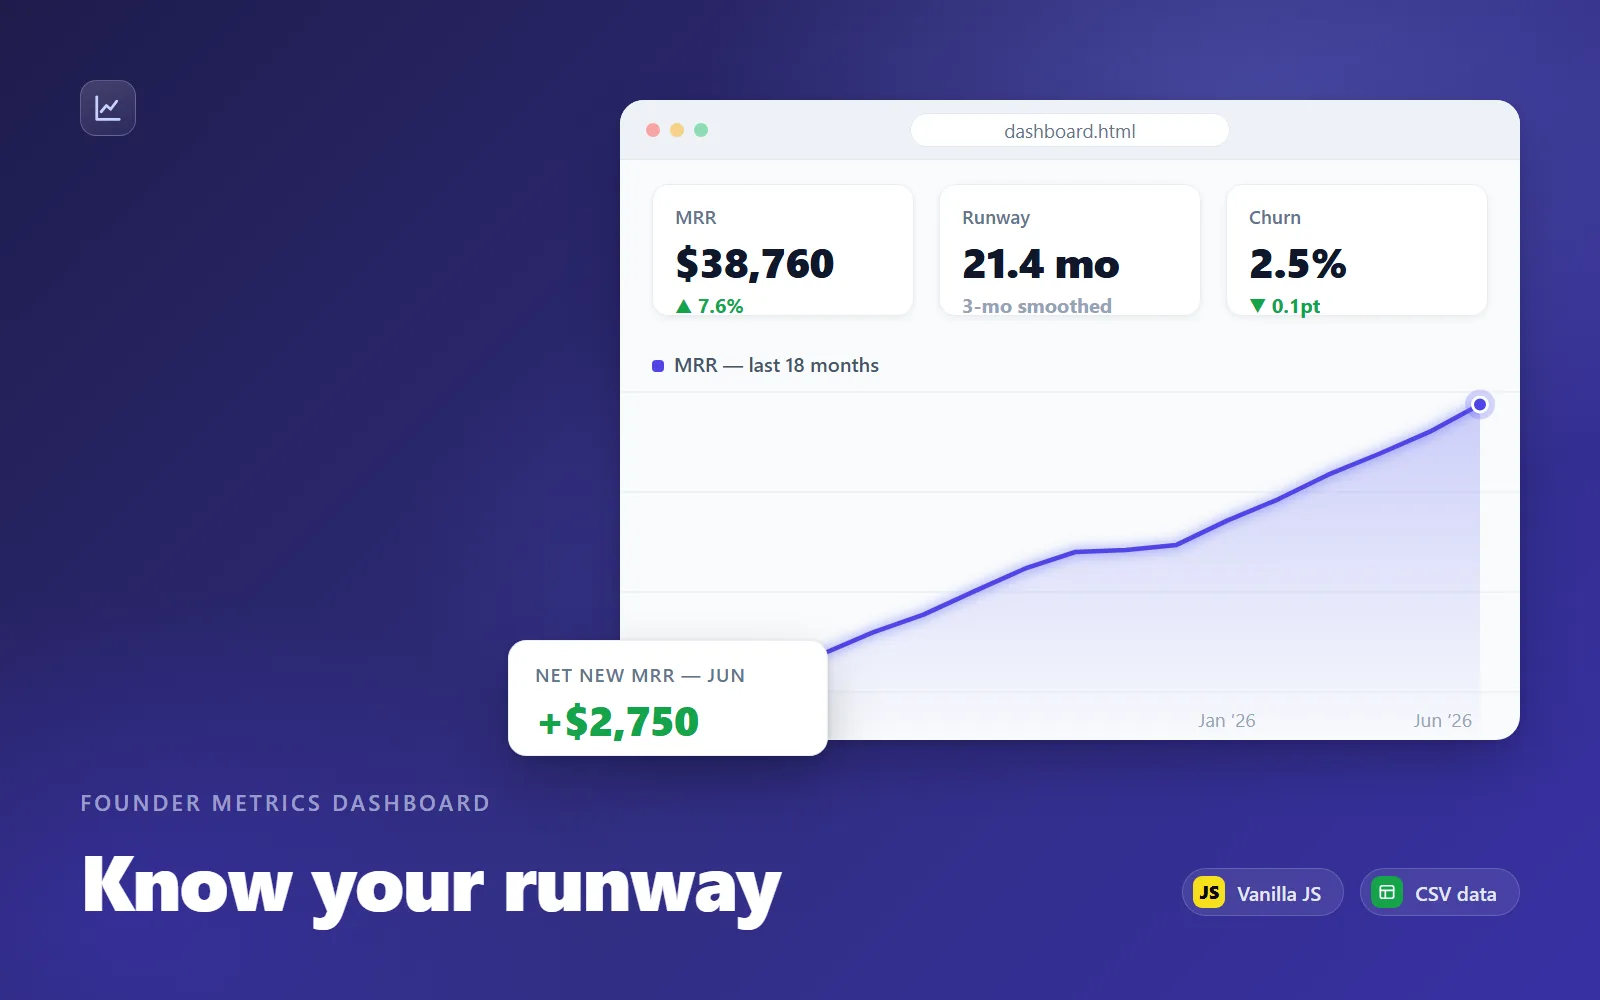
Founder Metrics Dashboard
A single-file HTML dashboard that turns your monthly CSV into MRR, growth, churn, burn and runway charts — no backend, no uploads.
Live demoLedger & Line$99