Preparing for launch…
Ecommerce Profit Dashboard
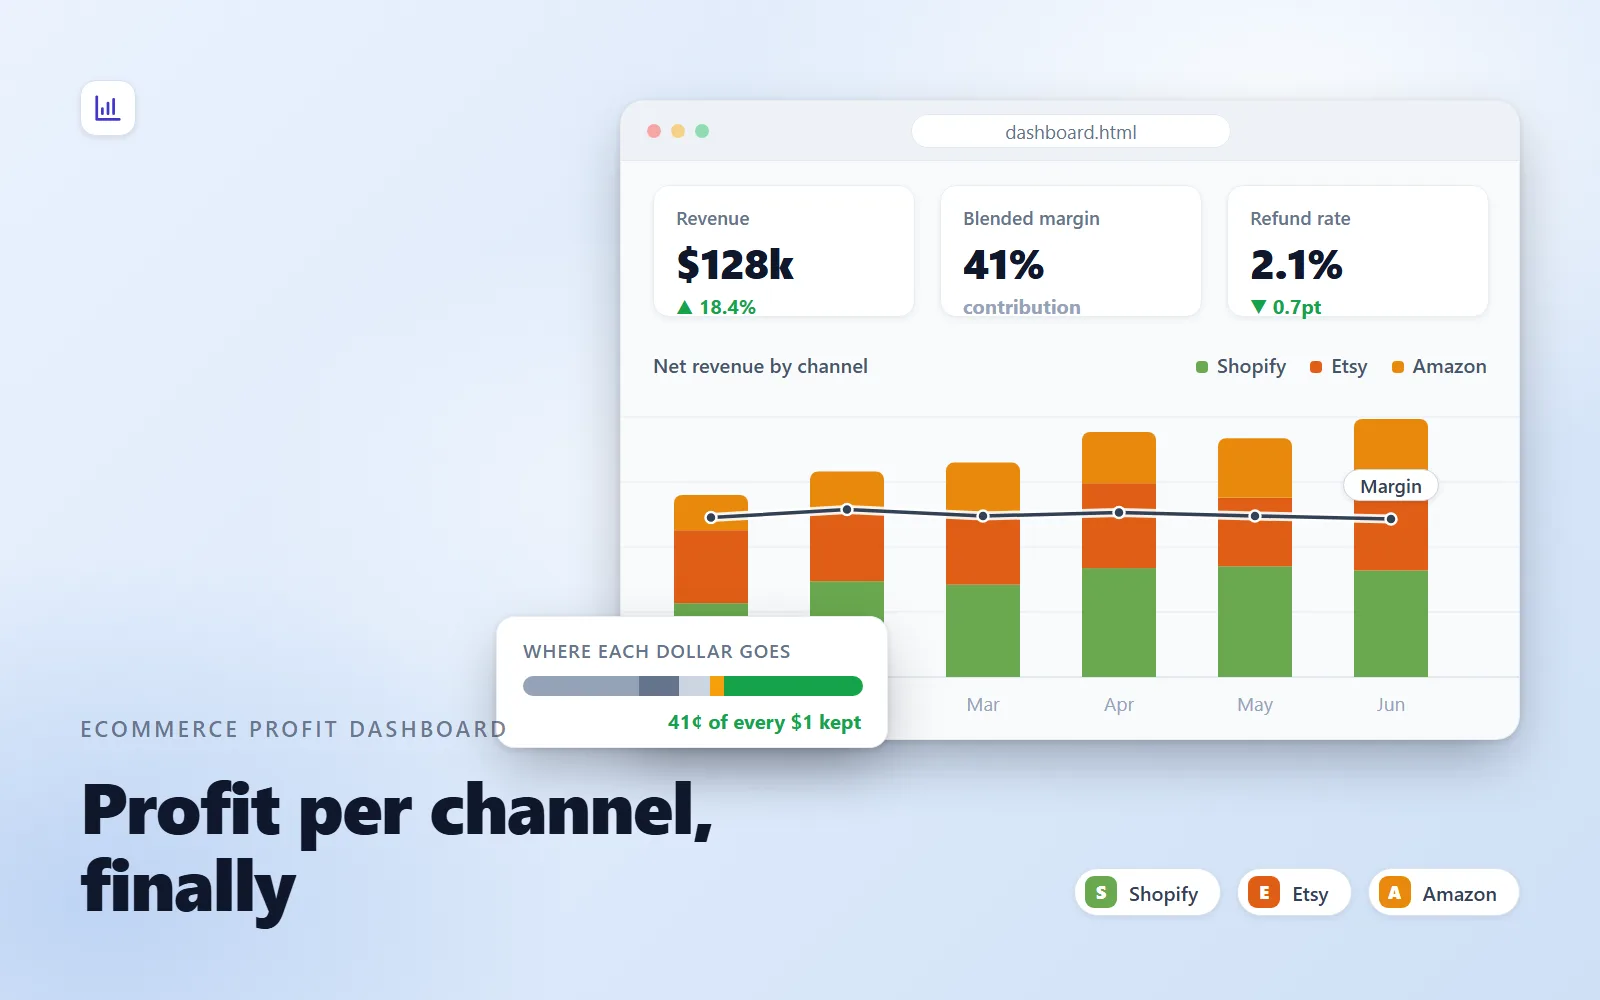
Load an orders CSV and see contribution margin by channel — revenue, COGS, fees, shipping, ad spend — in one zero-backend HTML file.
What it does & who it's for
Ecommerce Profit Dashboard is a complete multichannel P&L app that lives in one HTML file. Double-click dashboard.html, load a CSV of your orders (or click "Use sample data" to see it working instantly on the bundled 822-order dataset), and it turns revenue, COGS, platform fees, shipping and ad spend into the numbers that actually drive channel decisions: contribution margin in dollars and percent for every channel, blended vs per-channel margin side by side, AOV, refund rate, and a monthly trend of net revenue stacked by channel with the margin line overlaid. It's built for operators selling on Shopify, Etsy and Amazon at once — though any channel names in your CSV work — who know their topline but not which channel is actually making money once Amazon's referral and FBA fees or a creeping cost-per-order on ads are counted. The "Where each dollar goes" chart splits every channel's net revenue into COGS, fees, shipping, ads and what's left, so the channel that looks biggest and the channel that pays you most stop being confused for each other. The CSV loader is deliberately forgiving: only date, channel and revenue are required, common header variants ("Order Total", "Postage", "Selling Fees"...) are recognised automatically, currency symbols and messy cells are handled, and any problem rows are listed by number instead of failing silently. Everything is computed client-side in dependency-free vanilla JavaScript — money is handled in integer cents, charts are hand-drawn SVG with hover tooltips, and the file makes zero network requests, which you can verify by running it offline. Your sales data never leaves your machine. A dedicated print stylesheet means Print report → Save as PDF produces a clean monthly snapshot for your accountant, business partner or your own records. Compared with DIY spreadsheets, every formula is implemented once, documented exactly in metrics-definitions.md, and can't be fat-fingered at row 400. Compared with subscription analytics tools, there's no monthly fee, no OAuth hand-over of your store data, and no integration to break — you own readable source you can re-theme by editing one block of CSS variables. Try the live demo: it is the actual product running on the bundled sample.
What's included
- dashboard.html — the complete dashboard app in one self-contained file (inline CSS + vanilla JS, zero dependencies, sample data embedded) - sample-orders.csv — 822 believable orders across 6 months and 3 channels (Shopify, Etsy, Amazon); doubles as your input template - metrics-definitions.md — the exact formula behind every metric, plus date, currency and refund conventions - README-setup.md — 60-second quick start, CSV preparation guide per platform, monthly workflow, customisation and troubleshooting
What's not included
- No platform integrations or APIs — you export order CSVs yourself, and COGS always comes from your own cost sheet (no platform exports it) - No overhead or net-profit modelling — the dashboard reports contribution margin by design, not rent, salaries or software subscriptions - No multi-currency conversion — use one currency consistently per file - No xlsx input — data must be CSV, which every spreadsheet tool exports
Requirements
Any modern desktop browser (Chrome, Edge, Firefox or Safari). A spreadsheet tool or text editor to maintain your orders CSV. No server, no install, and no internet connection needed after download.
Setup instructions
1. Download the deliverables and keep the four files together in one folder. 2. Double-click dashboard.html — it opens in your default browser. 3. Click "Use sample data" to see the dashboard fully populated immediately. 4. Open sample-orders.csv in Excel, Google Sheets or Numbers, replace the sample rows with your own orders (keep the header row), and save/export as CSV — only date, channel and revenue are required; the other columns sharpen the margin picture. 5. In the dashboard, click "Load CSV" or drag your file anywhere onto the page. 6. Each month, append the new orders to your CSV, reload it, and click "Print report" → Save as PDF for a shareable monthly snapshot.
Version history
- v1.0Latest27 July 2026
Licence & terms
Licence terms
Single-project commercial licence. You may use, modify and re-theme the dashboard for one business or project (yours or one client's), including internal sharing of the file and PDF reports produced with it. You may not resell, redistribute, sublicense or repackage the files or derivatives of them as a product or template, whether paid or free. For use across multiple client projects, purchase one licence per project.
Refund policy
14-day refund if the product is materially not as described. Please try the live demo first — it is the actual dashboard running on the bundled sample orders, so what you see there is exactly what you get. Refunds aren't offered for change of mind after download, since the deliverables are the product in full. An approved refund ends your licence to the product — you must delete all copies of the files and stop using them.
Support terms
Email support for 6 months from purchase, covering loading problems, CSV formatting questions and clarification of metric definitions. Customisation work (new charts, new metrics, restyling) is outside support scope, though the commented source is yours to modify under the licence.
These terms are snapshotted at purchase — what you see here is what applies to your order.
Reviews
No reviews yet
Reviews come from verified purchasers only, so you can trust what you read here.
More in Data & Dashboards
Other listings buyers compared with this one.
 Test-run
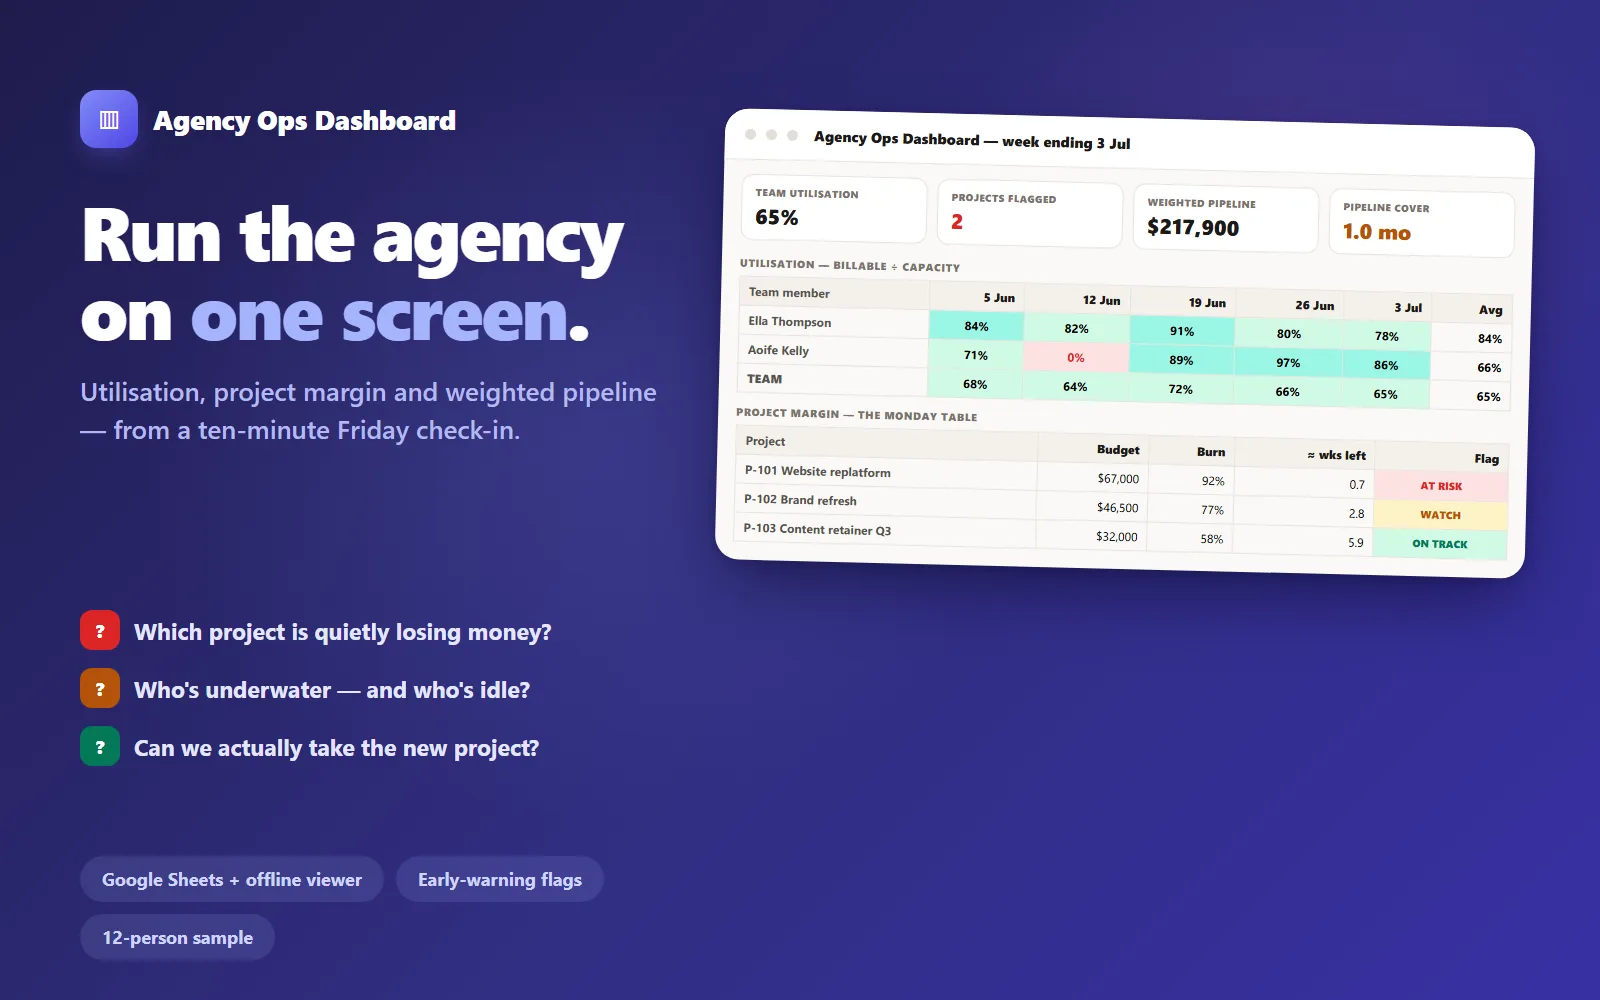
Agency Ops Dashboard
Utilisation, project margin and weighted pipeline on one screen — from a ten-minute Friday check-in. Google Sheets build plus an offline viewer that computes the same numbers.
Live demoLedger & Line$119
 Test-run
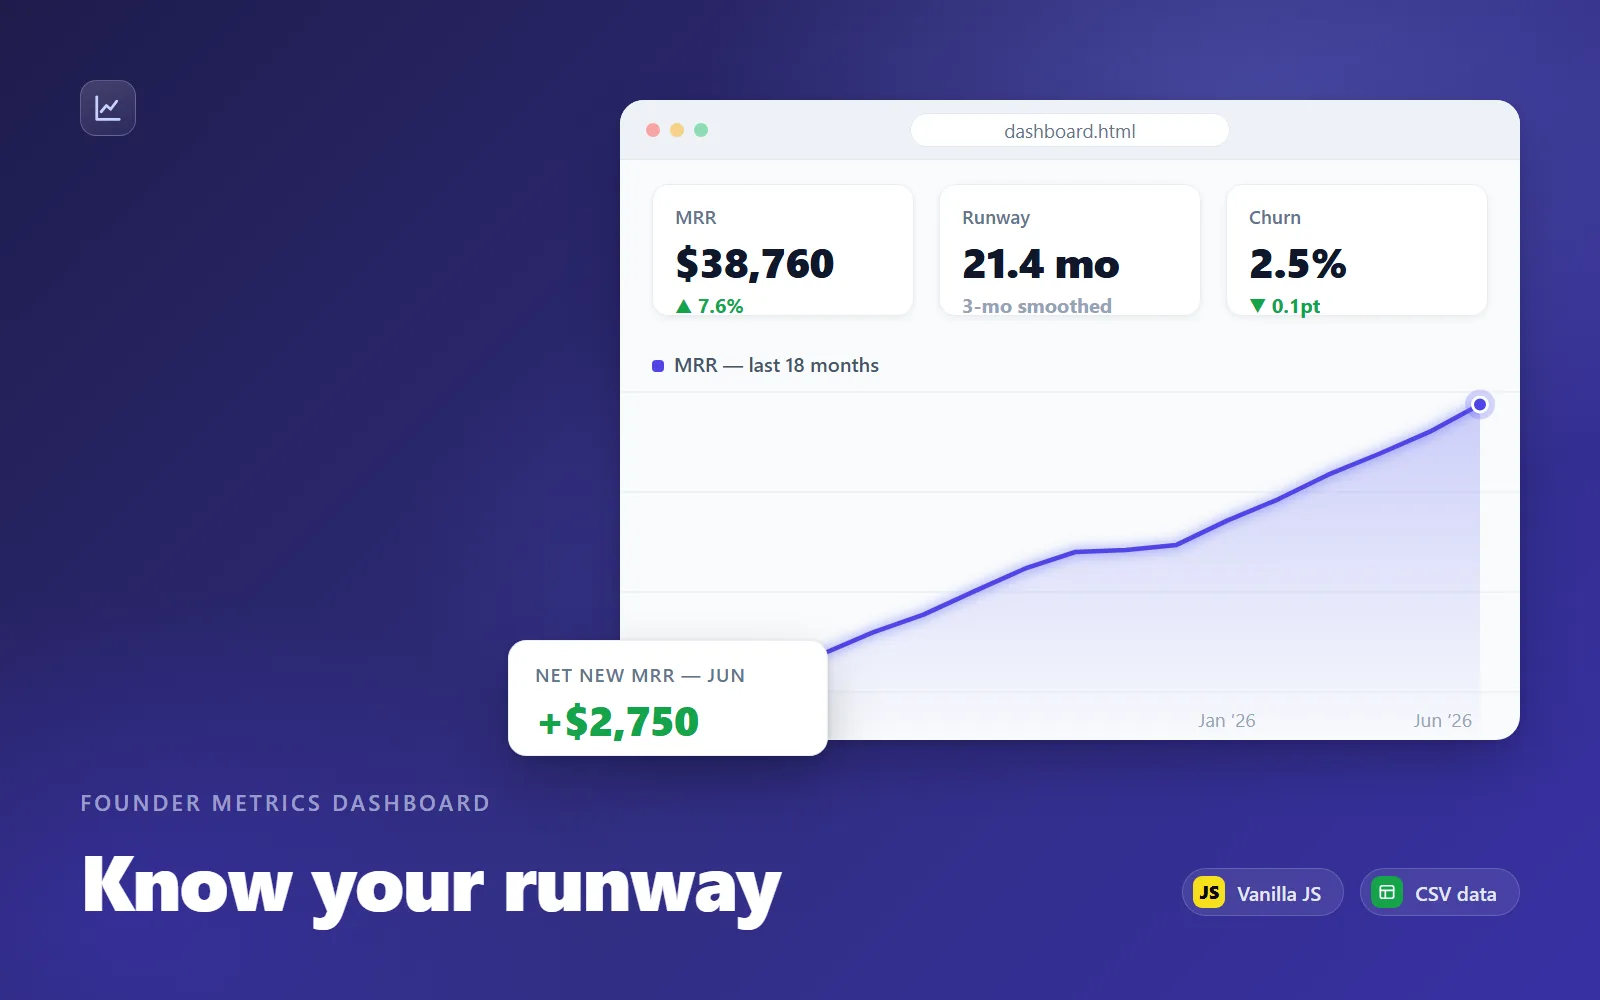
Founder Metrics Dashboard
A single-file HTML dashboard that turns your monthly CSV into MRR, growth, churn, burn and runway charts — no backend, no uploads.
Live demoLedger & Line$99