Preparing for launch…
Founder Metrics Dashboard
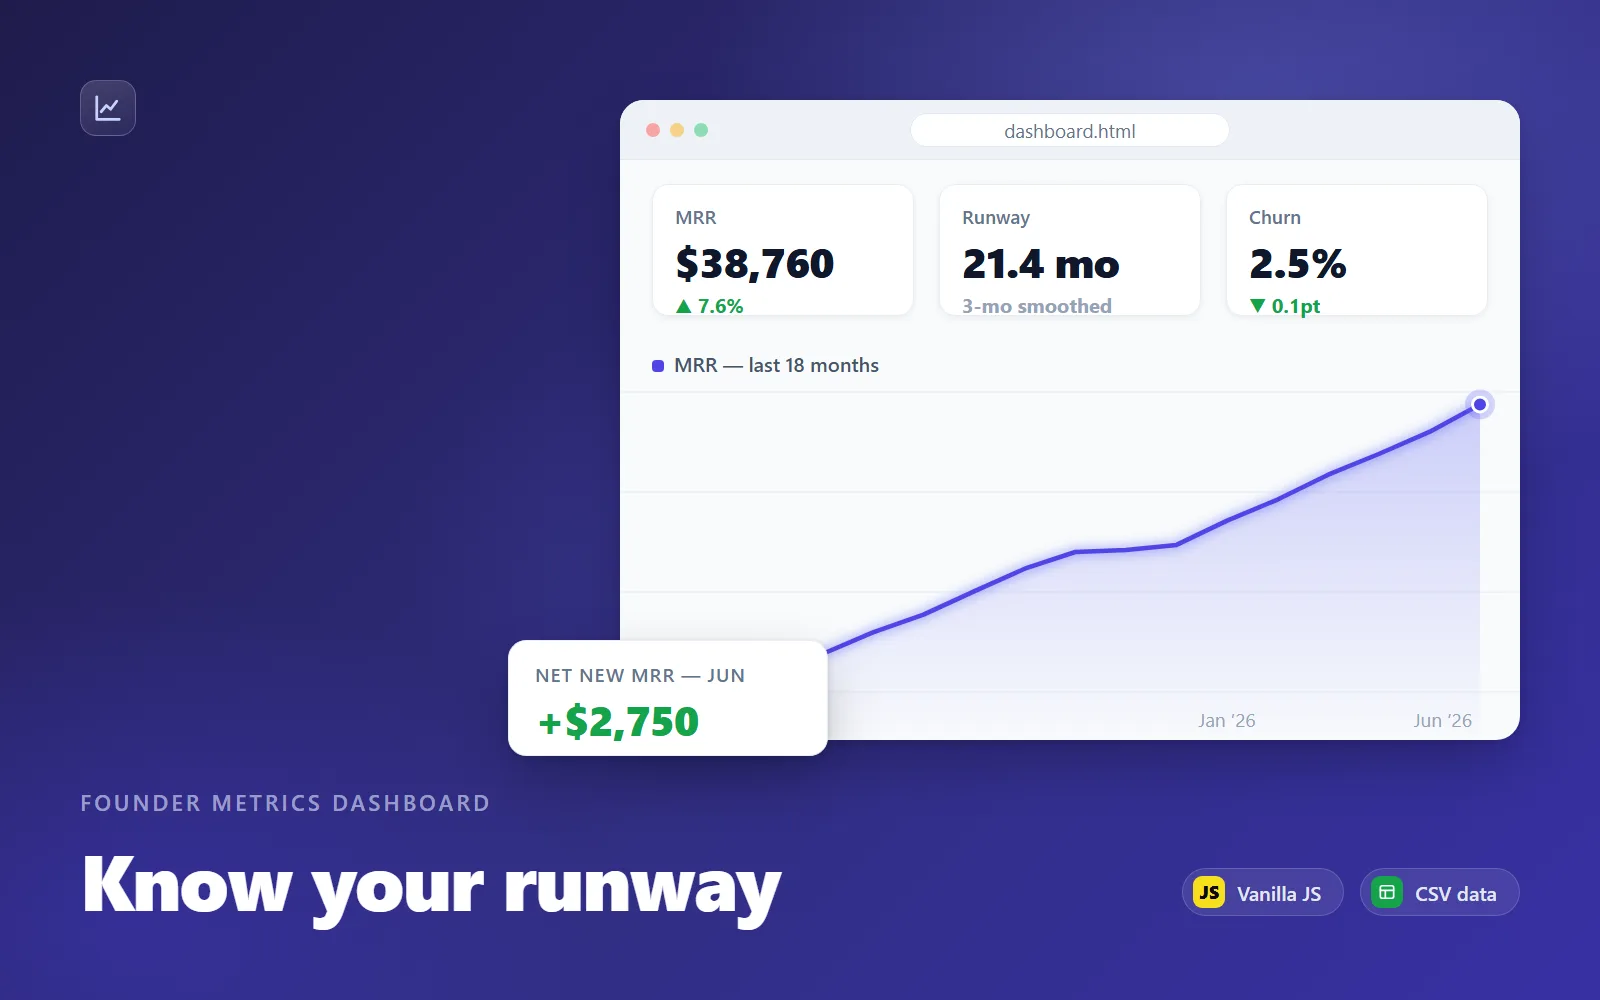
A single-file HTML dashboard that turns your monthly CSV into MRR, growth, churn, burn and runway charts — no backend, no uploads.
What it does & who it's for
Founder Metrics Dashboard is a complete startup-metrics app that lives in one HTML file. Double-click dashboard.html, load a CSV of your monthly numbers (or click "Use sample data" to see it working instantly), and it renders ten KPI cards and six interactive charts: MRR with month-over-month and 3-month-average growth, an MRR movements breakdown (new, expansion, churned, contraction), customer counts, gross and net MRR churn alongside customer churn, ARPA, net burn, cash balance with funding markers, and a runway figure smoothed over a 3-month burn average so one lumpy invoice doesn't whipsaw your most important number. It's built for early-stage founders who keep their numbers in a spreadsheet but need something presentable and trustworthy for investor updates, board packs and their own monthly ritual. Only four CSV columns are required — month, MRR, expenses, cash balance — and every optional column you add (MRR movements, customer counts, funding) unlocks more cards and charts automatically. The included 18-month sample dataset doubles as your template: open it, replace the rows with your months, done. Everything is computed client-side in dependency-free vanilla JavaScript with hand-drawn SVG charts — no build step, no CDN, no fonts to fetch, no network requests at all. Your revenue and cash figures never leave your machine, which you can verify by running it with the internet disconnected. Charts have hover tooltips and an All/12m/6m range switch, drag-and-drop CSV loading just works, and a dedicated print stylesheet means "Print report → Save as PDF" produces a clean board-ready snapshot with the data table expanded. Compared with DIY, you skip the part where spreadsheet chart ranges silently break and churn formulas get fat-fingered at month 14 — every metric here is implemented once, documented with its exact formula in metrics-definitions.md, and auditable in readable source you own. Compared with subscription metrics tools, there's no monthly fee, no billing-system integration to wire up, and no third party holding your financials. Buy it once, drop in a CSV each month, and re-theme it by editing one colour constant if you want it on-brand.
What's included
- dashboard.html — the complete dashboard app in one self-contained file (inline CSS + vanilla JS, zero dependencies) - sample-metrics.csv — 18 months of realistic seed-stage SaaS data that doubles as your input template - metrics-definitions.md — the exact formula behind every metric, with edge cases and conventions explained - README-setup.md — 60-second quick start, CSV preparation guide, monthly workflow, customisation and troubleshooting
What's not included
- No automated integrations — you export or type your monthly numbers into the CSV yourself (figures from Stripe, Xero, QuickBooks etc. paste straight in) - No forecasting or scenario modelling — the dashboard reports actuals only - No multi-currency handling — use one currency consistently in your CSV - No xlsx input — data must be CSV, which every spreadsheet tool exports
Requirements
Any modern desktop browser (Chrome, Edge, Firefox or Safari). A spreadsheet tool or text editor to maintain your monthly CSV. No server, no install, and no internet connection needed after download.
Setup instructions
1. Download the deliverables and keep the four files together in one folder. 2. Double-click dashboard.html — it opens in your default browser. 3. Click "Use sample data" to see the dashboard fully populated immediately. 4. Open sample-metrics.csv in Excel, Google Sheets or Numbers, replace the sample rows with your own months (keep the header row), and save/export as CSV. 5. In the dashboard, click "Load CSV" or drag the file anywhere onto the page. 6. Each month, append one row with last month's numbers and reload the file; click "Print report" and choose Save as PDF for a board-ready snapshot.
Version history
- v1.0Latest26 July 2026
Licence & terms
Licence terms
Single-project commercial licence. You may use, modify and re-theme the dashboard for one business or project (yours or one client's), including internal sharing of the file and PDF reports produced with it. You may not resell, redistribute, sublicense or repackage the files or derivatives of them as a product or template, whether paid or free. For use across multiple client projects, purchase one licence per project.
Refund policy
14-day refund if the product is materially not as described. Please try the live demo first — it is the actual dashboard running on the bundled sample data, so what you see there is exactly what you get. Refunds aren't offered for change of mind after download, since the deliverables are the product in full. An approved refund ends your licence to the product — you must delete all copies of the files and stop using them.
Support terms
Email support for 6 months from purchase, covering loading problems, CSV formatting questions and clarification of metric definitions. Customisation work (new charts, new metrics, restyling) is outside support scope, though the commented source is yours to modify under the licence.
These terms are snapshotted at purchase — what you see here is what applies to your order.
Reviews
No reviews yet
Reviews come from verified purchasers only, so you can trust what you read here.
More in Data & Dashboards
Other listings buyers compared with this one.
 Test-run
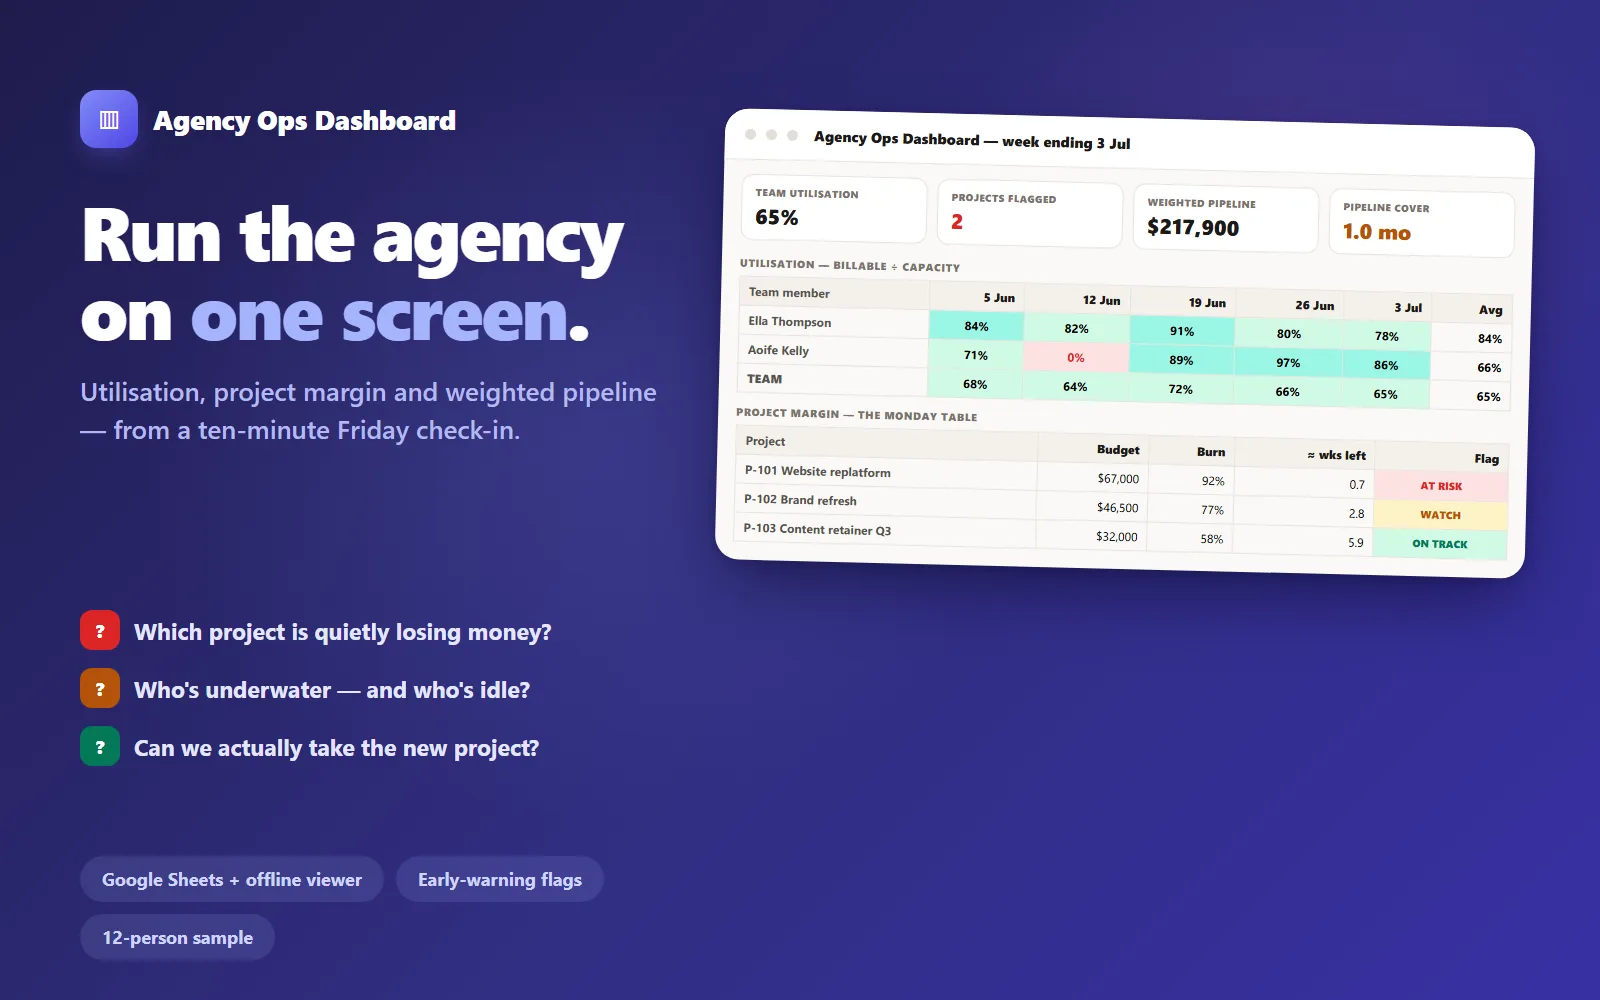
Agency Ops Dashboard
Utilisation, project margin and weighted pipeline on one screen — from a ten-minute Friday check-in. Google Sheets build plus an offline viewer that computes the same numbers.
Live demoLedger & Line$119
 Test-run
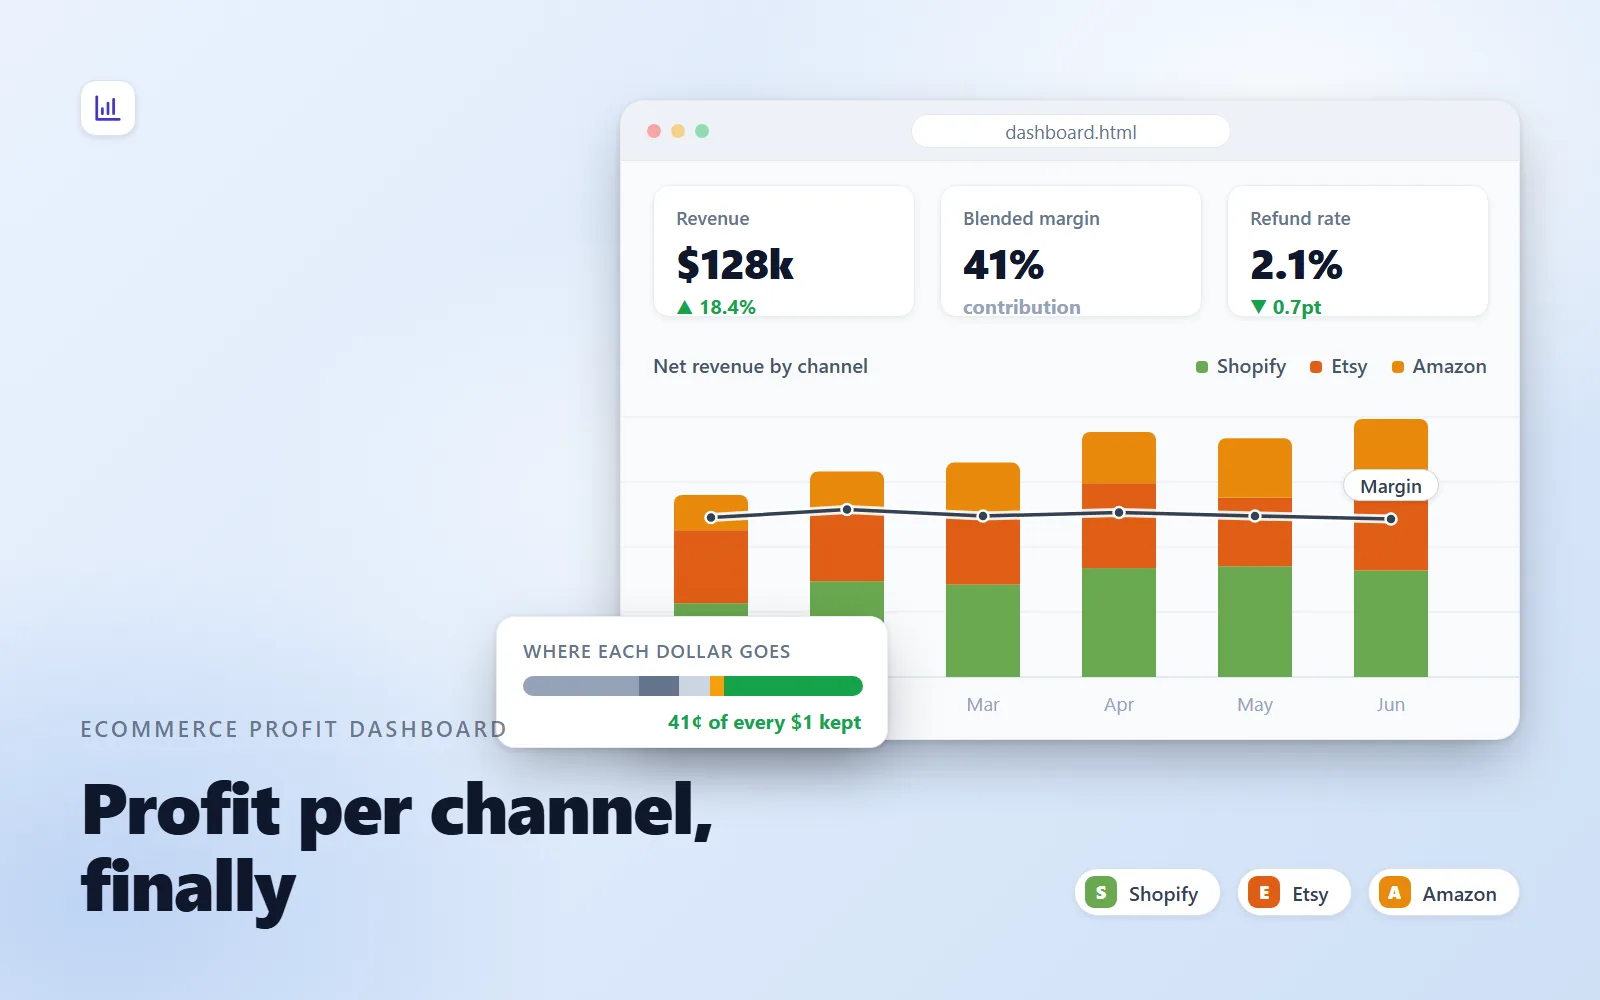
Ecommerce Profit Dashboard
Load an orders CSV and see contribution margin by channel — revenue, COGS, fees, shipping, ad spend — in one zero-backend HTML file.
Live demoLedger & Line$79